Data visualization layers in Choropleth maps
Visualize data on the map with data layers. Learn how to create and setup a data layer in Choropleth maps.

Layers define how the data will be aggregated and shown within boundaries in the Choropleth Maps. Go to the “Layers” menu item to add new layers or edit existing ones.
Data layer editor
The data layer editor is opened when an existing layer is edited or a new one added:
 You need to define a field, aggregation type, and palette to visualize data on the map.
Choose a field
First, choose a data field that is going to be visualized. You can add conditions to filter data rows by criteria.
 In addition, for versioned data rows - data rows with date defined - you need to choose which rows should be taken. For example, “the most recent”, “7 days old” or “1-month old”.
Set aggregation type
Here you need to choose how to aggregate data if more than one data row is located within a boundary. For example, summarize data, average value, and most frequent value.
Note! The proposed aggregation types depend on the type of field chosen. Aggregation types for a number field will be different than aggregation types of a string field.
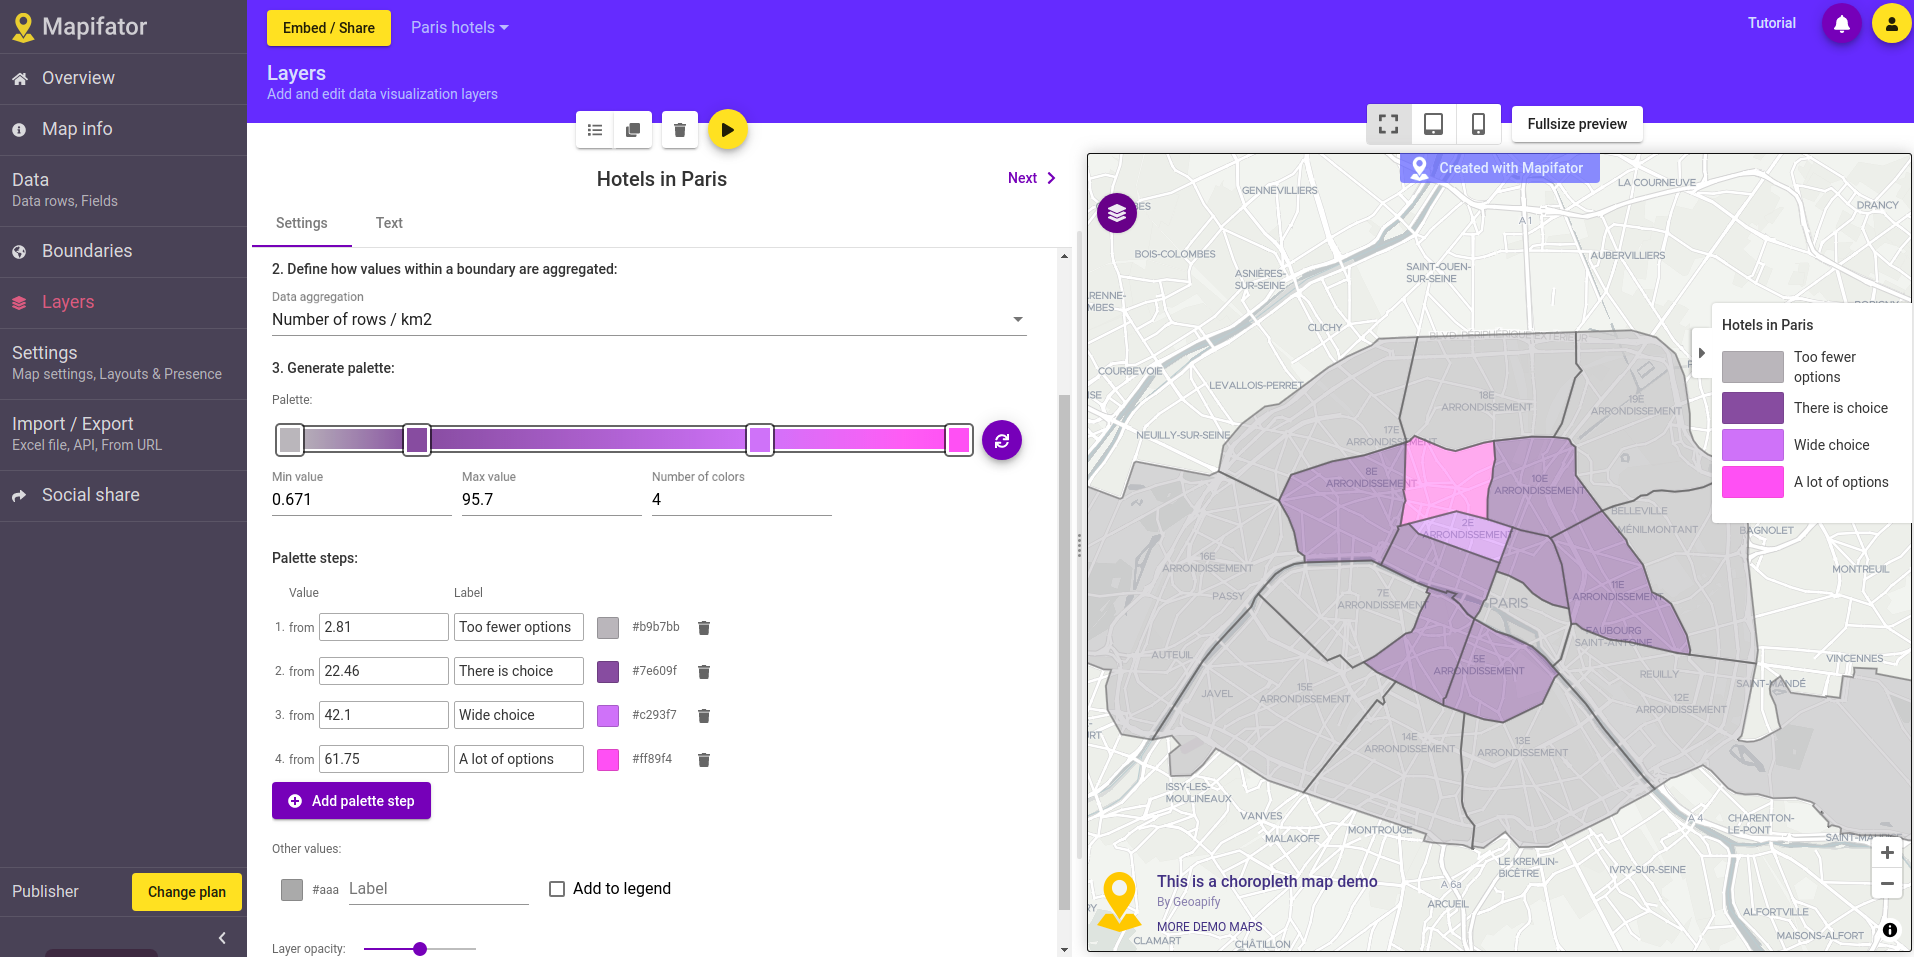
Define palette
Palette specifies steps and colors for the data visualization. In short terms, you define colors for values:
 You can use a simple 2-colors palette or add multiple colors. Press the “Generate” button to create palette steps.
Add layer labels and text
On the “Text” tab you can define which label and description the data layer will have on the choropleth map.

- Label - a label that appears in the layers selector
- Title - a layer label that appears in the Legend when the layer is selected
- Description - a layer description that appears in the Legend when the layer is selected
- Related to boundary info - information about the layer that appears when a user hovers or clicks on the boundary
In Addition, you can add boundary information that is related to a palette step.
Layers list
On the “Layers” tab you can define the order of the layers in the layers selector and define a default layer that will be active when a map is loaded.
Have more questions?
Contact us with a live-chat or write us an email ([email protected]) if you have questions!