Choropleth map editor tutorial
It's easy to create a choropleth map with Mapifator. Choropleth map editor lets you define all the map components with a graphical interface.

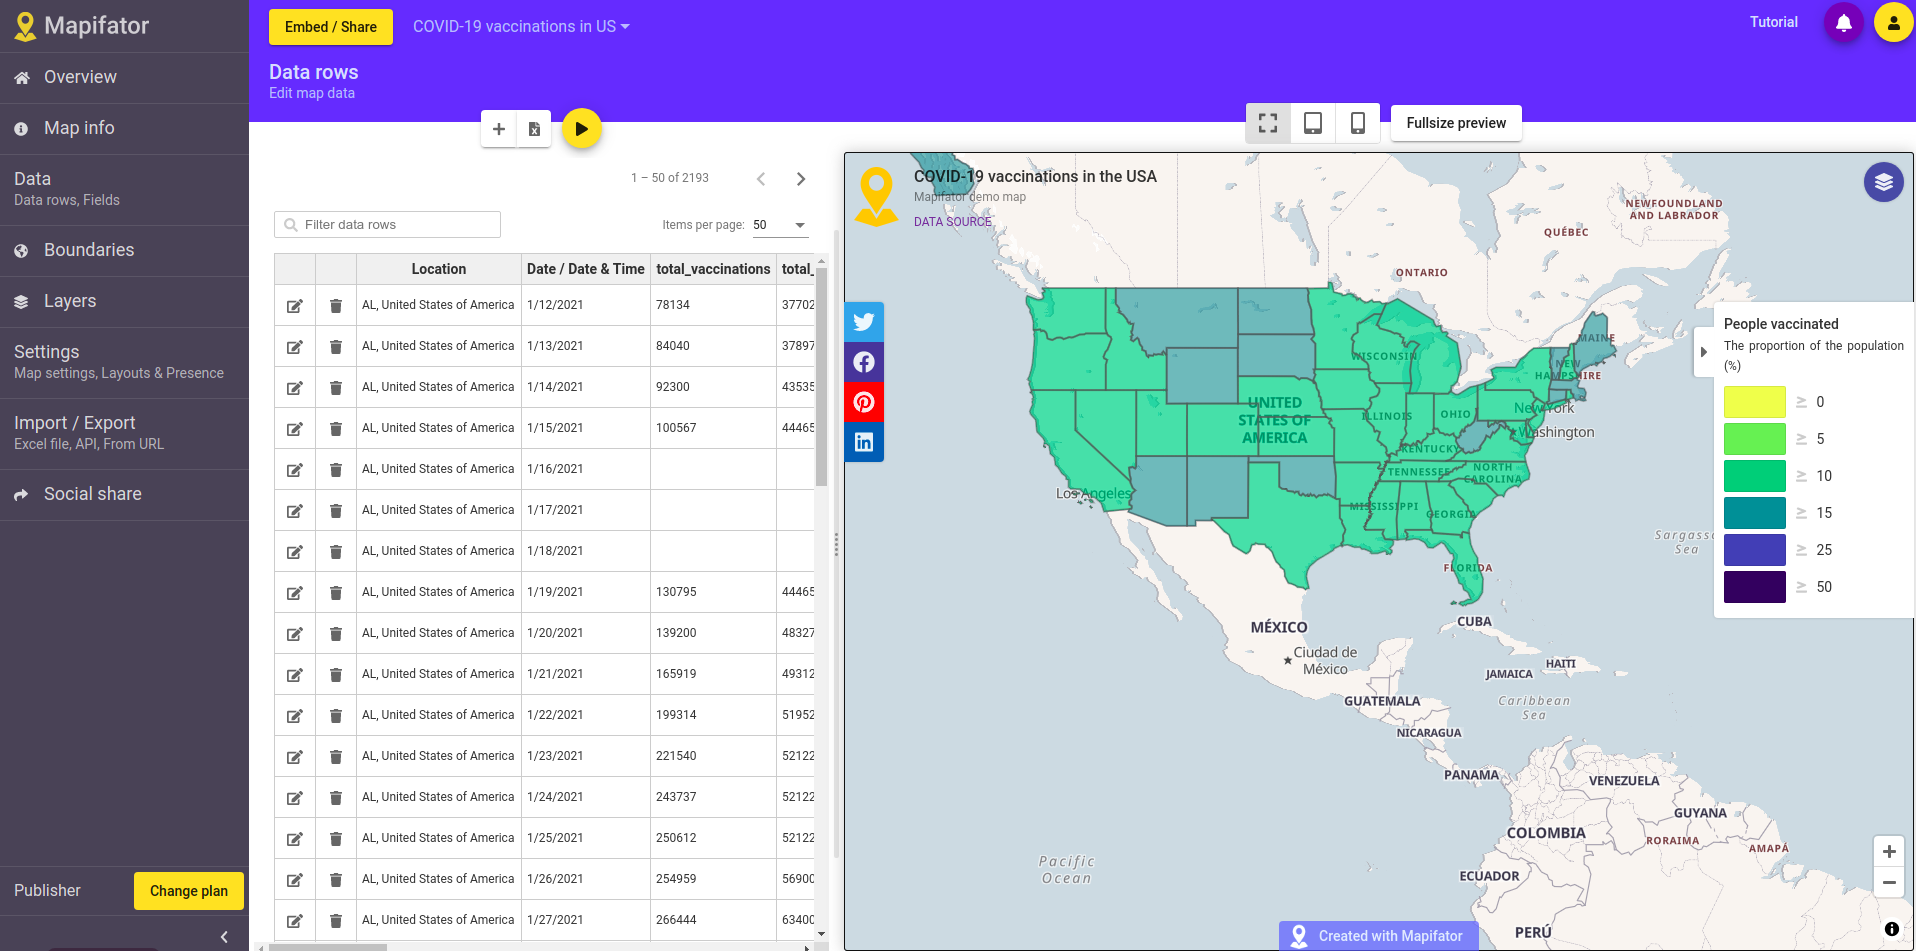
The Choropleth Map editor is opened when you create or open a choropleth map in Mapifator. Here you can edit your choropleth map and see how it will look like.
- Use the menu panel on the left to switch between different parts of the editor.
- Click on the preview buttons to check how the map will adjust to different screen sizes.
Choropleth map parts
The Choropleth map consist of the 3 main components:
- Data - a set of data rows;
- Boundaries - one or multiple boundaries groups;
- Data layers - layers that define how the data is accumulated and displayed within boundaries.

Data
You can import data to the Mapifator Chotopleth map from a file or URL. Each data row consists of:
- Location - coordinates or address where the data row belongs to;
- Date / Date time - date or timestamp of the data. You can add multiple versions of the same data and filter by data later;
- Fields - custom data fields of text, number, boolean types. You can also add fields that are calculated on other field values.

Boundaries
On the “Boundaries” tab you can edit or add new boundaries groups. Mapifator lets to choose boundaries just by clicking on the map, with location input or by querying subdivisions (states, counties, districts) of a region.

Layers
You can add one or multiple data layers to the choropleth map. Each data layers defines:
- Which field to visualize
- How to aggregate multiple values if more than one data row belongs in a boundary
- Palette and legend

In addition, you can define the text that will be shown then a boundary hovered or clicked.
Map info
Go to “Map info” tab to add information about the map, data sources and links:

Map style and settings
Go to “Map settings” to choose a map style and settings:

Map style and settings
Go to “Layouts & Presence” to define choropleth map buttons and components layouts, choose colors:
 Here you can also add a chart that will be shown on boundary hover or click.
Live data for the map
You can show always actual data on the map by setting up an external source for the map:

Social networks share buttons
You can add social media share buttons to the map and define share text, image and titles:

Embed/share map
Click the “Embed/share” button to get share links and embed code for the map. Click copy button to put the required string into the clipboard.
Mapifator questions and support
The most of the editor tabs contain a video tutorial button. Watch the video to learn more about the feature. Do not hesitate to contact us directly in the live chat if you have any questions!