Create a choropleth map from an Excel or CSV file data
Learn how to visualize data from an Excel or CSV file on a Choropleth Map. Import data, choose boundaries, and setup a data layer.

You can create a choropleth map within minutes with Mapifator map builder by improrting data from an Excel or CSV file. You can import data from:
- “Data” tab
- “Import/Export” → “Excel file” tab

Click the import button. This will open Import from a file Wizard.
Import from a file wizard
1. Choose a file
Choose an Excel or CSV file. Note, we use a comma as a separator for a CSV file. You can choose another separator if a different one is used.

2. Classify data columns
Tell Mapifator which data is in every column. You can skip columns you don’t want to add to the map.
Important! You need to provide location information for data rows. Select “Location” field in the appropriate column(s).
You can define a location in several ways:
- Provide address as a location. Mapifator will search for locations automatically. Note, that the maximal number of rows for address search is 300;
- Provide longitude and latitude coordinates. Mapifator will use those coordinates as location.

3. Check locations
The next step of the Wizard will show you where the data rows were mapped. Here you can review and edit locations. In addition, you can skip some locations. The corresponding rows will be skipped as well.

4. Choose boundaries
Choose boundaries at the next step that will be used to visualize data. Mapifator offers a few ways to choose boundaries:
- From an address input;
- Click on the map and accept the desired boundary;
- Query subdivisions of a region. This allows getting states, counties, and other regions that belong to the region.

5. Create data visualization layer
Choropleth map data layers create map visualizations basing on the following information:
- Data field;
- Aggregation type;
- Palette steps and colors.

6. Import data
This is the last step of the wizard. It provides an overview of the import. Press “Import” to import the data.
Note! If the map contains already some data rows, you can choose between 2 options:
- replace existing data;
- add new data rows.

The wizard will bring you back to the map editor when the data will be imported.
Setup map style and layout
Now you can setup the map style and layouts. You can do than in the “Settings” tab.

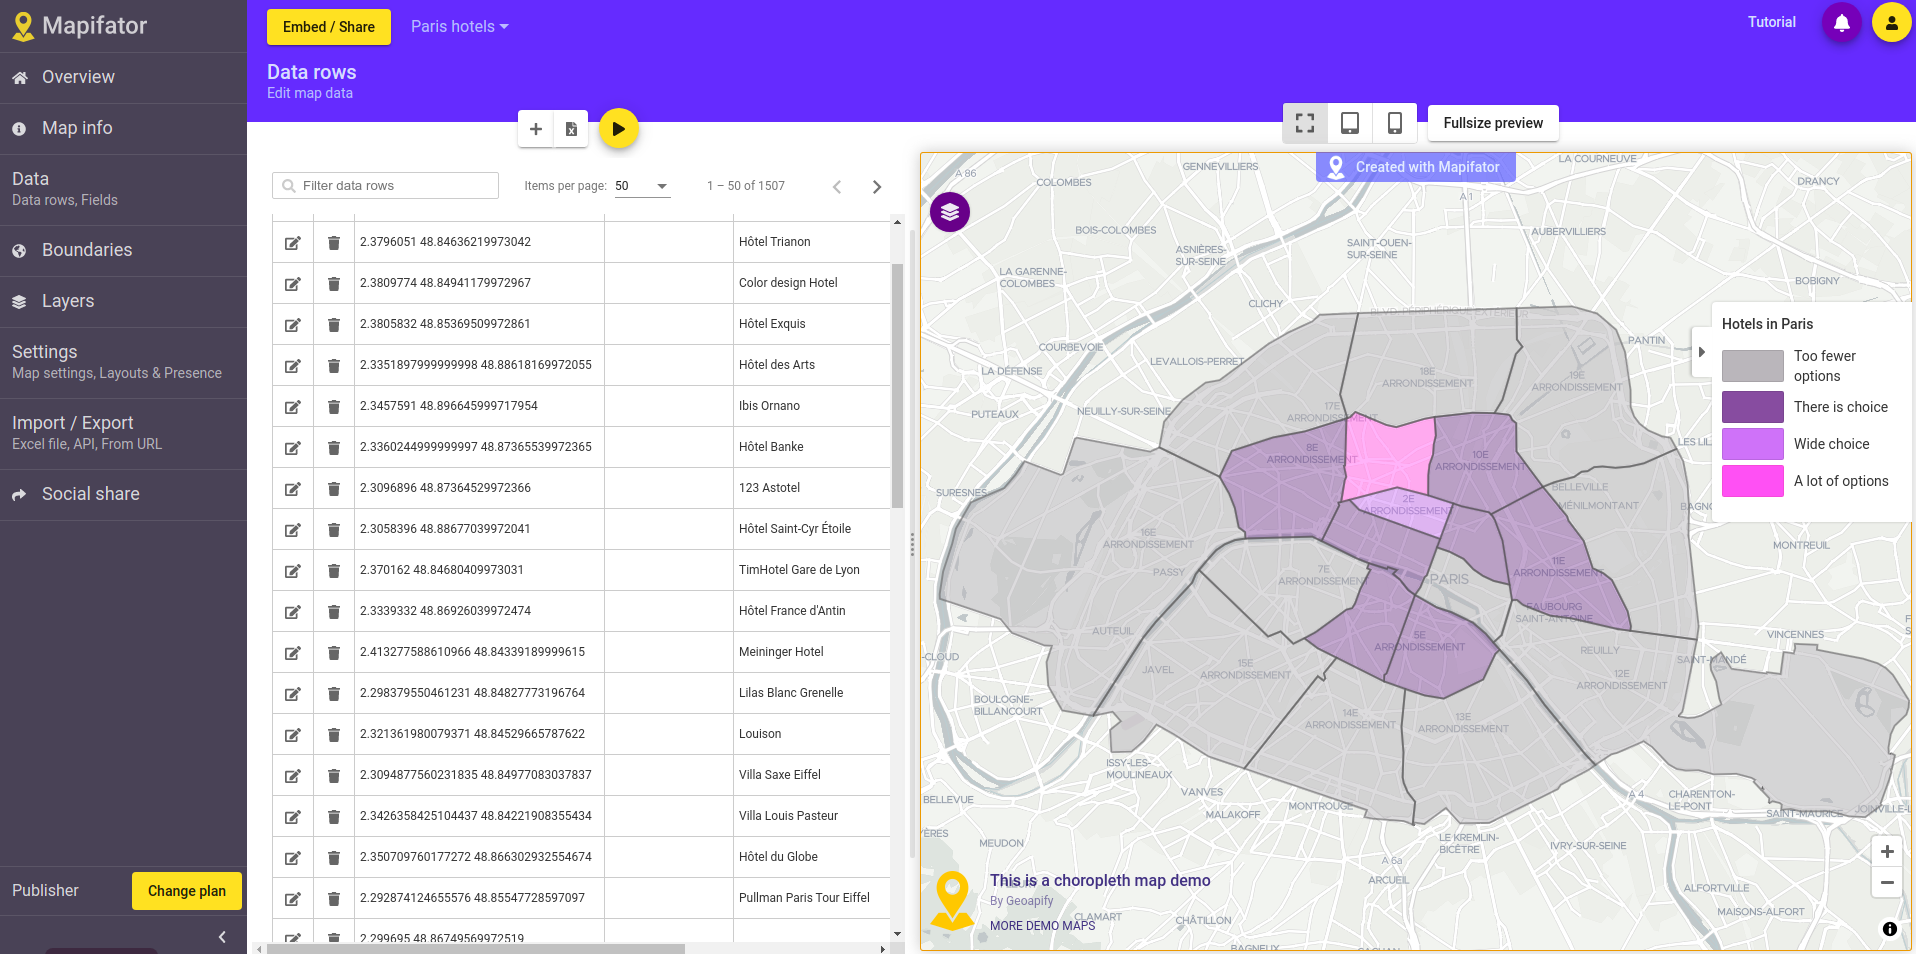
Embed/share map
Click the “Embed/share” button to get share links and embed code for the map. Click copy button to put the required string into the clipboard.
Mapifator questions and support
The most of the editor tabs contain a video tutorial button. Watch the video to learn more about the feature. Do not hesitate to contact us directly in the live chat if you have any questions!