Create a choropleth live-map from CSV source
Learn how to make a live-map with a CSV source. We create a "COVID-19 vaccinations traction in the US" map as a map example.
Mapifator allows setting an external data source for a map. That lets to create “live-maps” that show actual data. Let’s go step by step and create a live-map that shows COVID-19 vaccination traction in the US.
We used “Our World in Data/covid-19-data” data hosted on GitHub as the map data source.
Set an external URL as a data source for a choropleth map
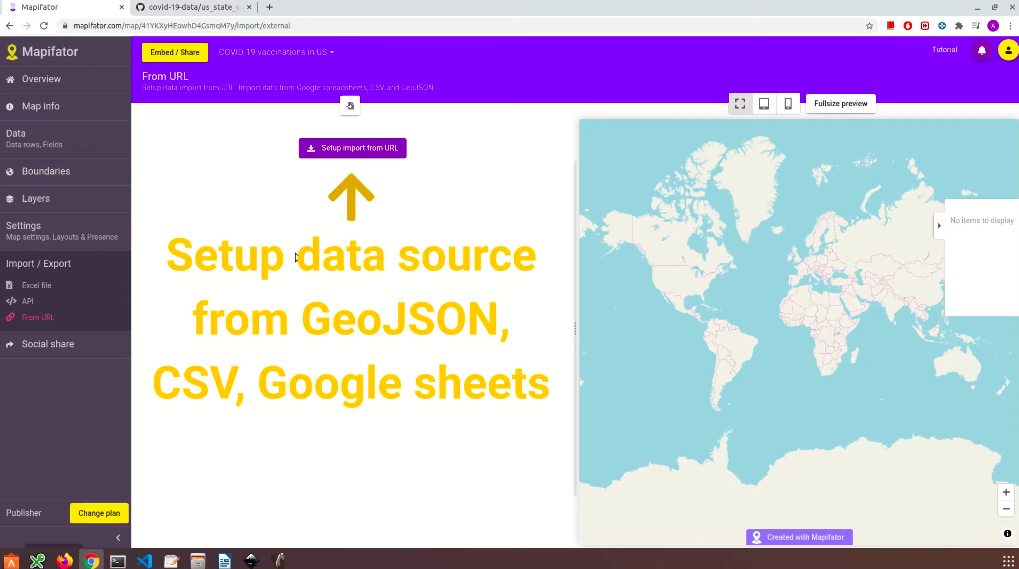
Go to “Import/Export” → “from URL” tab to set an external data source for your map:
Click on the “Setup import from URL”. This will open a wizard.
Enter a document URL
Choose “CSV” as a URL type and enter a document URL:
Note! You need to enter a URL to a raw file version. For example, in GitHub, you need to click the “Raw” button to open it. Click “Test URL” to be sure that the document is accessible and contains data.
Map columns to data
At the next step of the wizard, you need to tell Mapifator which data is in loaded columns:
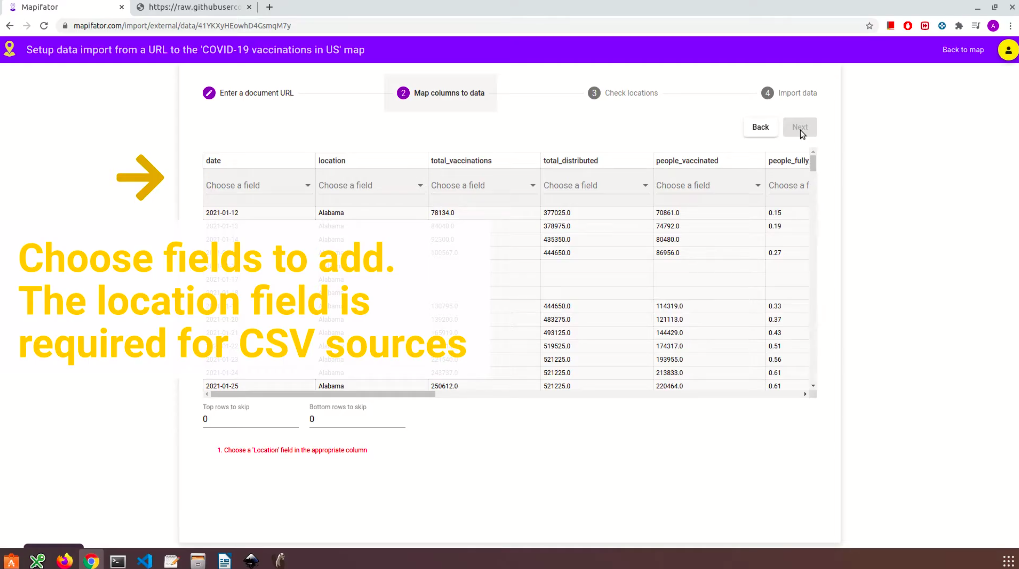
Each data row should contain location information to be able to map it to the map.
In addition, it may have Date / Date-Time data. You need date information if the original source contains versioned data. You can skip this field if your data source contains only actual data.
Check locations
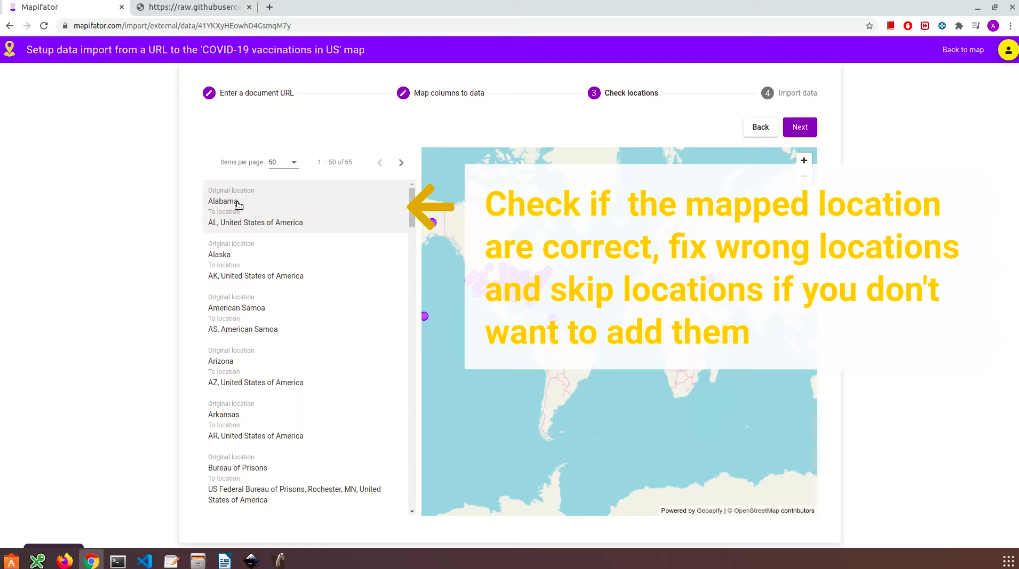
The “Check locations” wizard step will map data rows to locations. It will search for a corresponding location when an address provided as a location.
You need to check if all locations are correct, fix them if they are not. You have also an option to skip some locations.
Note! Mapifator will use coordinates as a location if you provided longitude and latitude. It’s preferred way to define a location if you have a big number of rows.
Import data
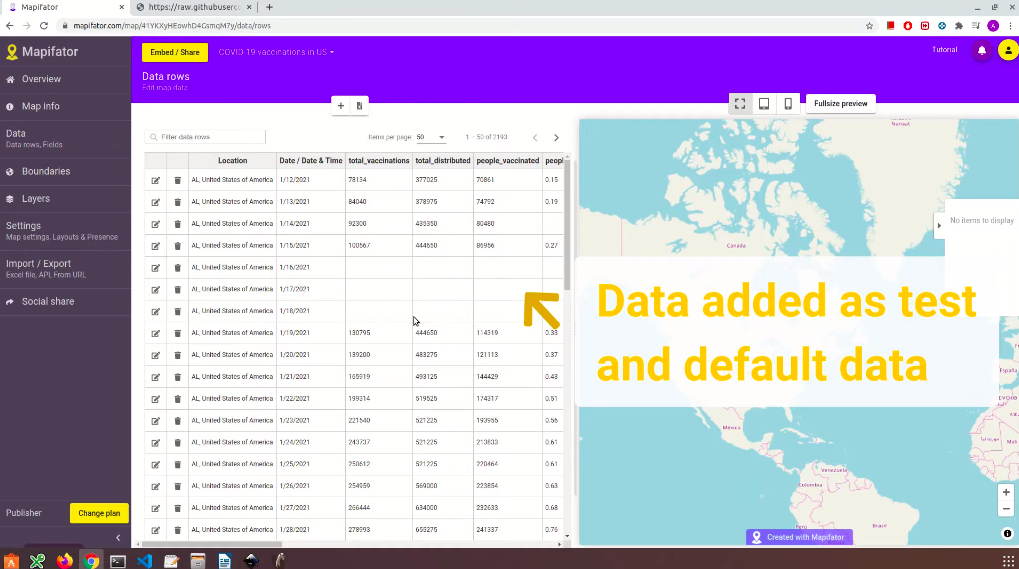
The next wizard step will give an overview of data rows and data fields to be imported. Here you have an option to load current data as default and test data or leave the map empty. Click the “Import data” button to import data.
Then the wizard will bring you back to the map editor:
Add boundaries
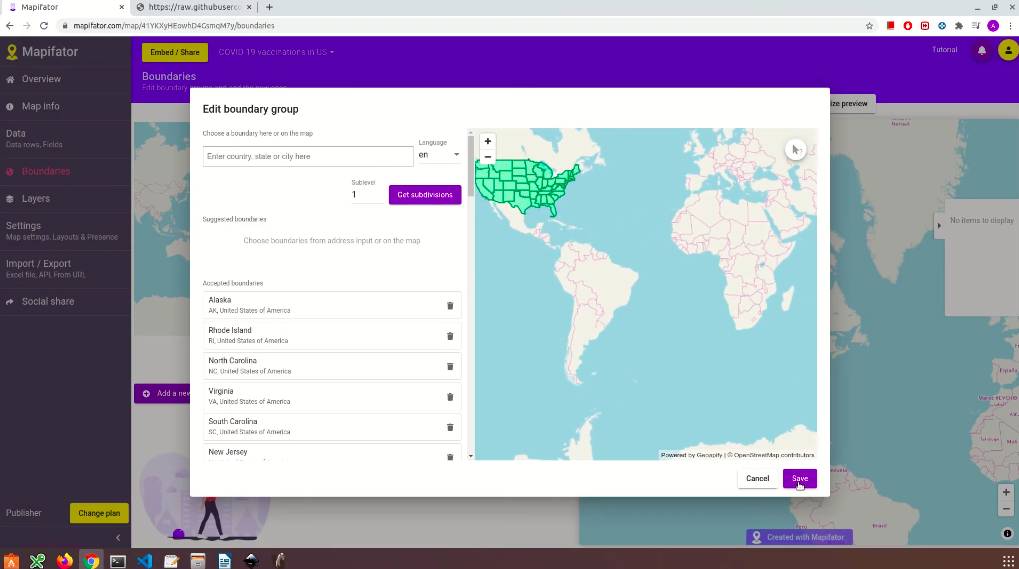
Now you need to add boundaries, that will be used to visualize data. Go to the “Boundaries” tab to add a new boundaries group.
It’s easy to get all the states:
- Enter “United States” into address input and choose the country;
- Get subdivisions. This will show you all subdivisions of the country;
- Remove the ones you want to skip and accept the rest.
Learn more about adding and editing boundaries in Mapifator.
Add data layers
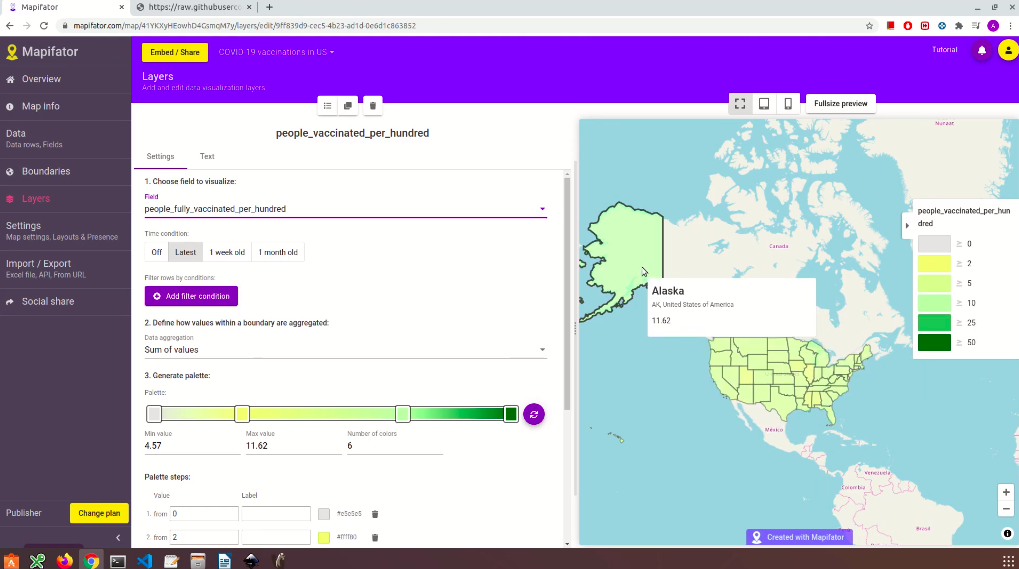
Then add the last required component of a choropleth map - Data Layer. Go to the “Layers” tab to do that.
In the layer editor you can choose the field to be visualized, a way to aggregate data, and setup palette:
Note! You have an option to set a time condition when you have versioned data. Set the “Latest” option to show the most actual data.
Learn more about adding and editing data visualization layers in Mapifator.
Embed or share you map
Click the “Embed/share” button to get map links and embed code.
When the map is loaded it will load the actual data from the provided link and visualize it.
COVID-19 vaccinations traction in the US map
Have more questions?
Contact us with a live-chat or write us an email ([email protected]) if you have questions!
