Create a choropleth live-map from GeoJSON source
Learn how to make a live-map with a GeoJSON source. We create a "COVID-19 7-day incidence coefficient in Germany" map as a map example.

Mapifator allows setting an external data source for a map. That lets to create “live-maps” that show actual data. Let’s go step by step and create a live-map that shows the COVID-19 7-day incident coefficient in Germany.
We used official data from “Robert Koch Institute” data hosted on ArcGIS Hub as the map data source.
Set an external URL as a data source for a choropleth map
Go to “Import/Export” → “from URL” tab to set an external data source for your map:

Click on the “Setup import from URL”. This will open a wizard.
Enter a document URL
Choose “GeoJSON” as a URL type and enter a document URL:

Note! GeoJSON that contains information for a whole country may consist of a few megabytes of data. The load can take a few seconds in that case.
Map columns to data
At the next step of the wizard, you need to tell Mapifator which data is in loaded columns:

The top row shows GeoJSON properties. Map the properties that you want to add to data fields.
Note! The Location field is not required when you use a GeoJSON data source. The location will be calculated from the GeoJSON feature geometry when the location field is not provided.
Check locations
The “Check locations” wizard step will map data rows to locations. It will search for a corresponding location when an address provided as a location. There is nothing to check if locations should be calculated from GeoJSON feature geometry:

Import data
The next wizard step will give an overview of data rows and data fields to be imported. Here you have an option to load current data as default and test data or leave the map empty. Click the “Import data” button to import data.
Then the wizard will bring you back to the map editor:

Boundaries
The boundaries are loaded from the GeoJSON:

Note! This is only test data. Actual data for boundaries is taken from GeoJSON when the map is loading.
Add data layers
You need a data layer to visualize the data on the map. In the layer editor you can choose the field to be visualized, a way to aggregate data, and setup palette:

Learn more about adding and editing data visualization layers in Mapifator.
Mapifator has an option to show layer data when a user hovers or clicks a boundary on the map. You can define the data to be shown on the “Text” tab of the layer editor:

Together with layer value, you can add the GeoJSON properties here.
Embed or share you map
Click the “Embed/share” button to get map links and embed code.
When the map is loaded it will load the actual data from the provided link and visualize it.
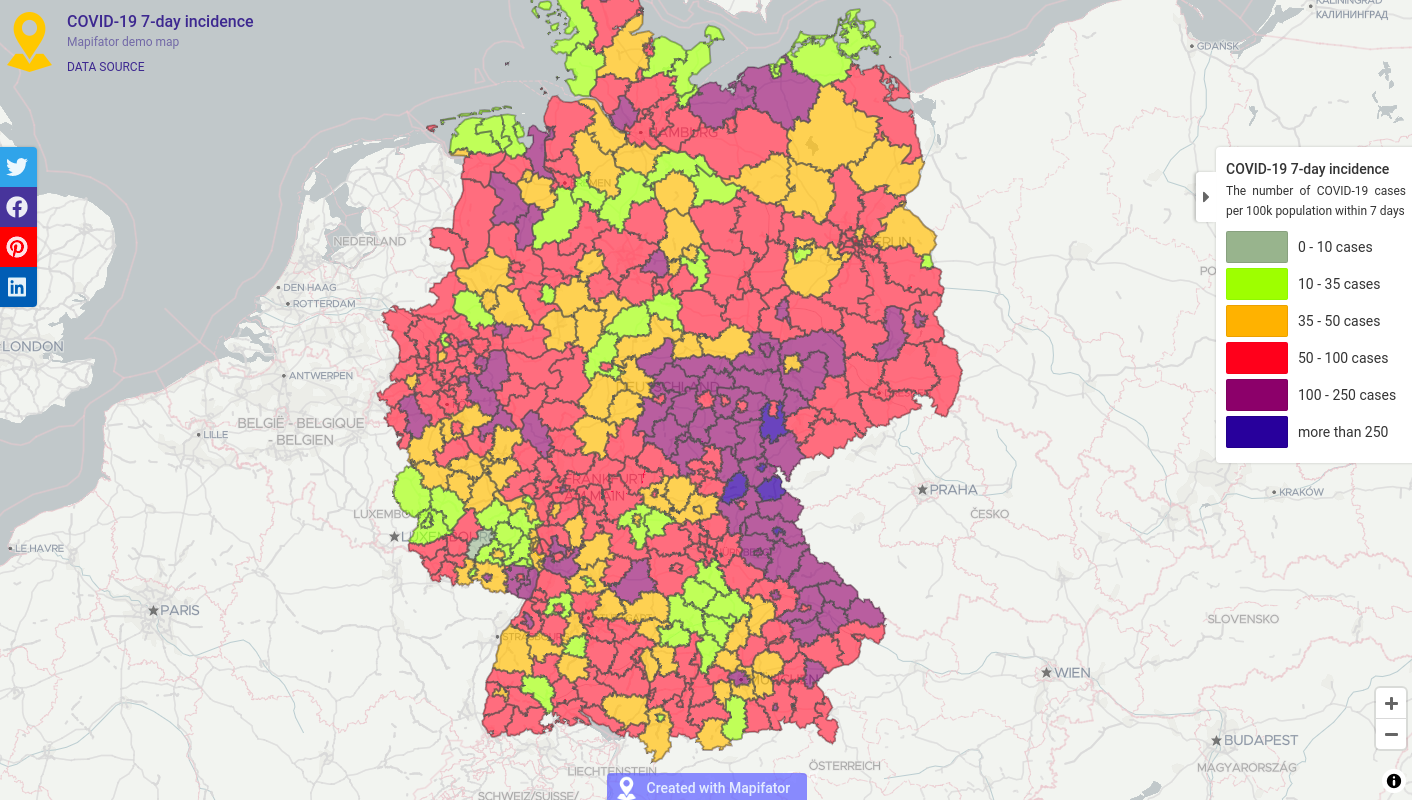
COVID-19 7-day incident coefficient in Germany live-map
Have more questions?
Contact us with a live-chat or write us an email ([email protected]) if you have questions!