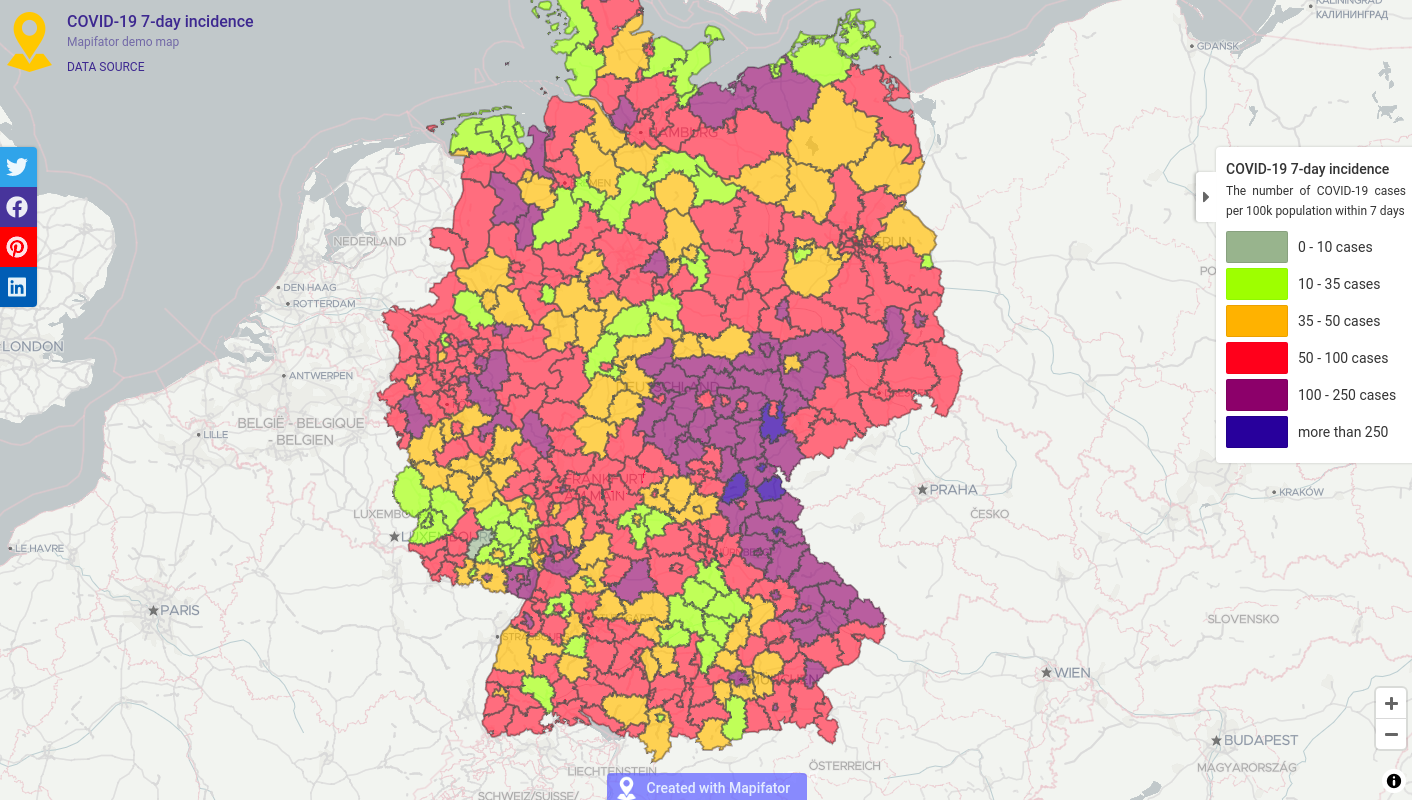
Choropleth mapTutorialLive mapCreate a choropleth live-map from GeoJSON sourceLearn how to make a live-map with a GeoJSON source. We create a "COVID-19 7-day incidence coefficient in Germany" map as a map example.
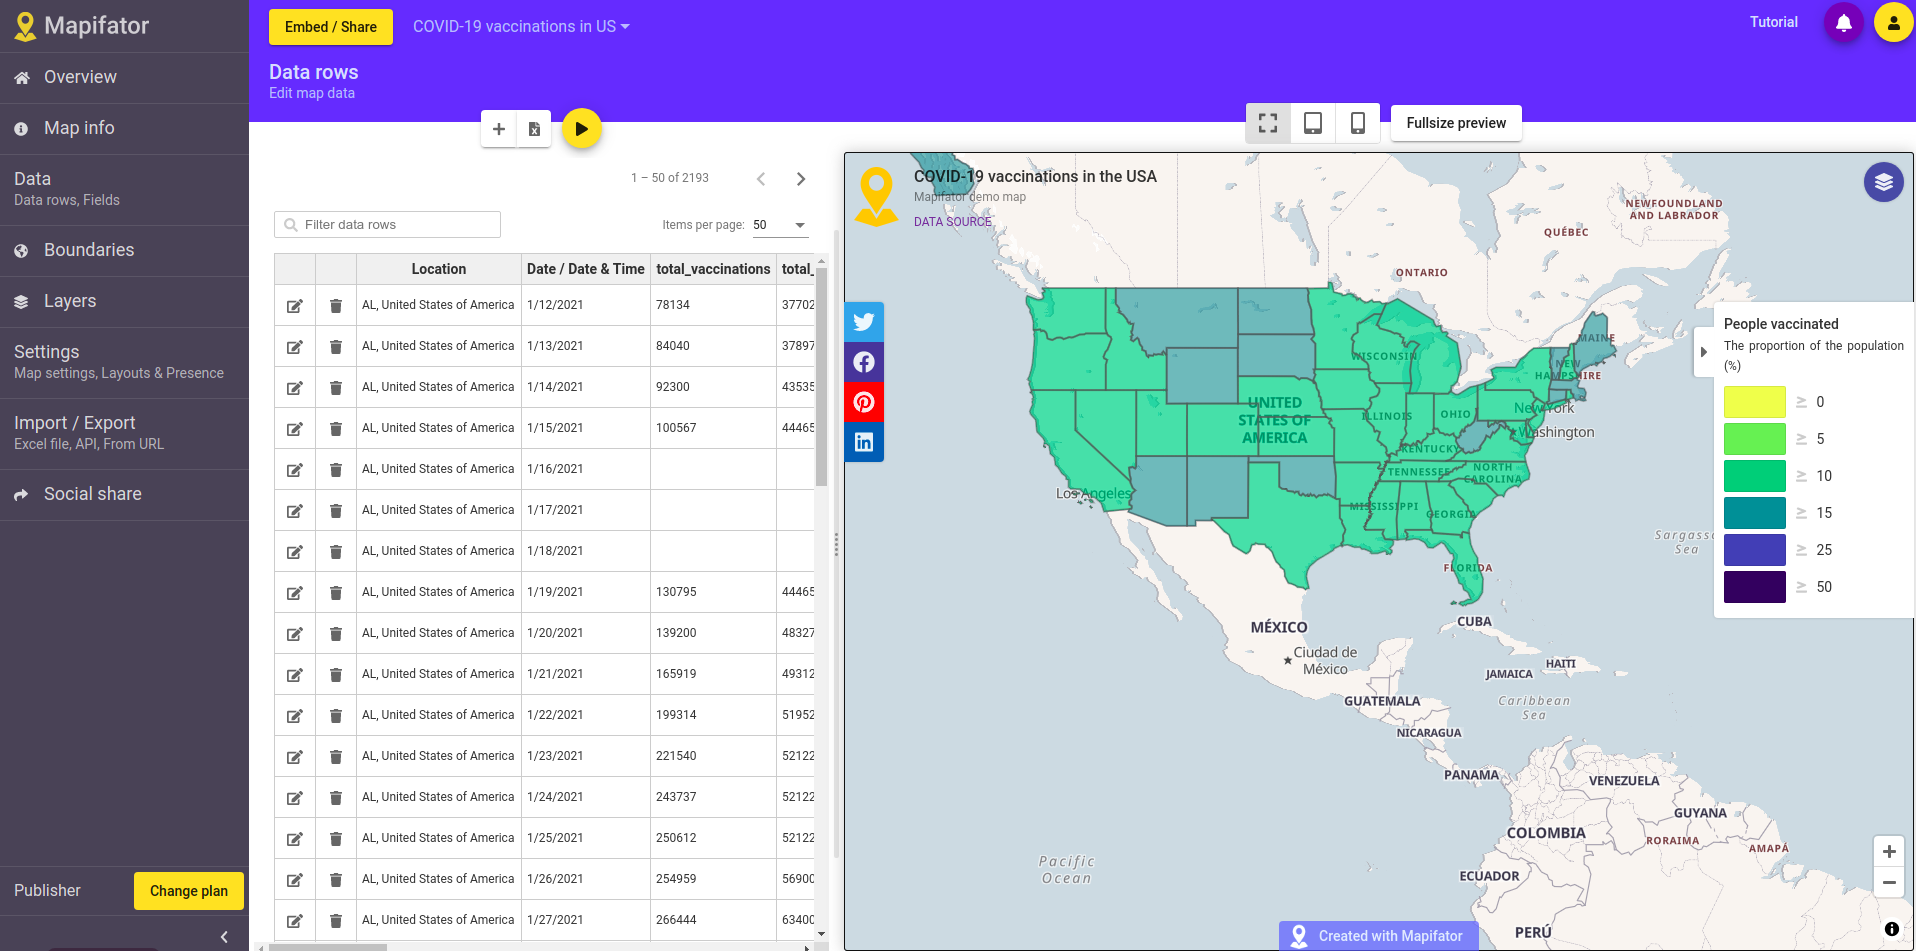
Choropleth mapTutorialLive mapCreate a choropleth live-map from CSV sourceLearn how to make a live-map with a CSV source. We create a "COVID-19 vaccinations traction in the US" map as a map example.
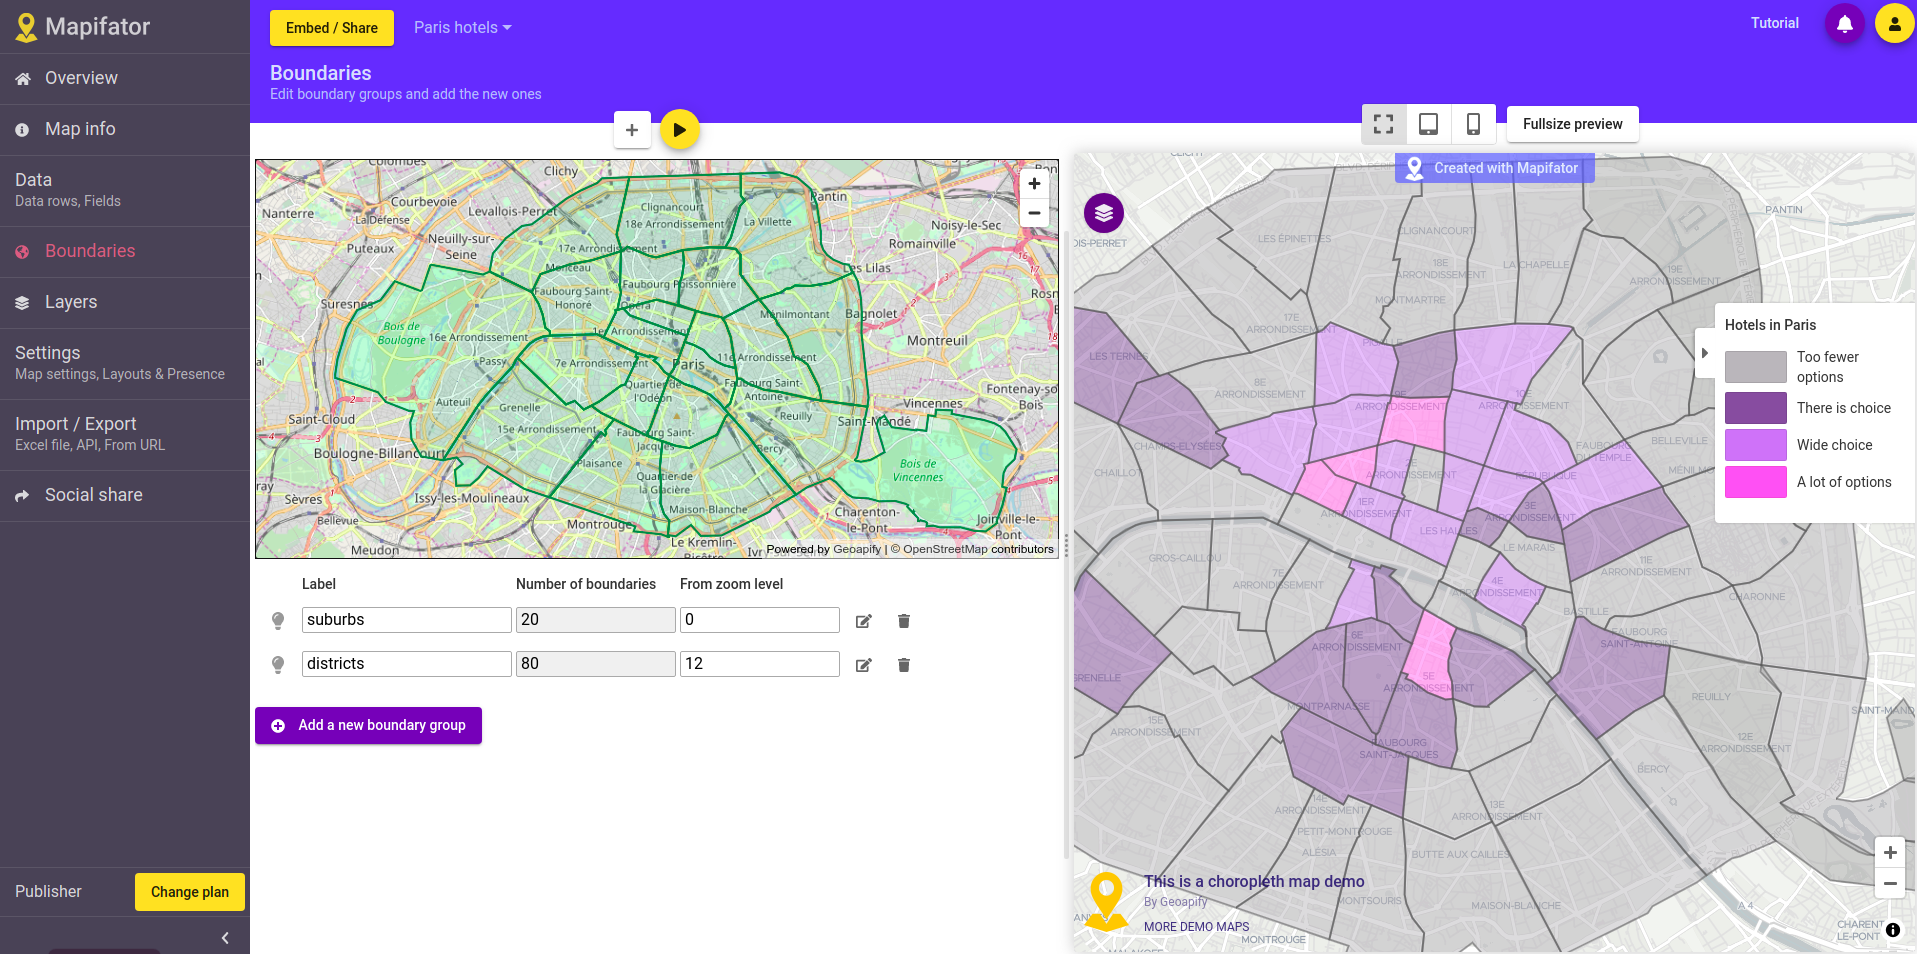
Choropleth mapTutorialBoundaries and regions in Choropleth mapsYou can choose administrative boundaries and their subdivisions by querying them or on the map.
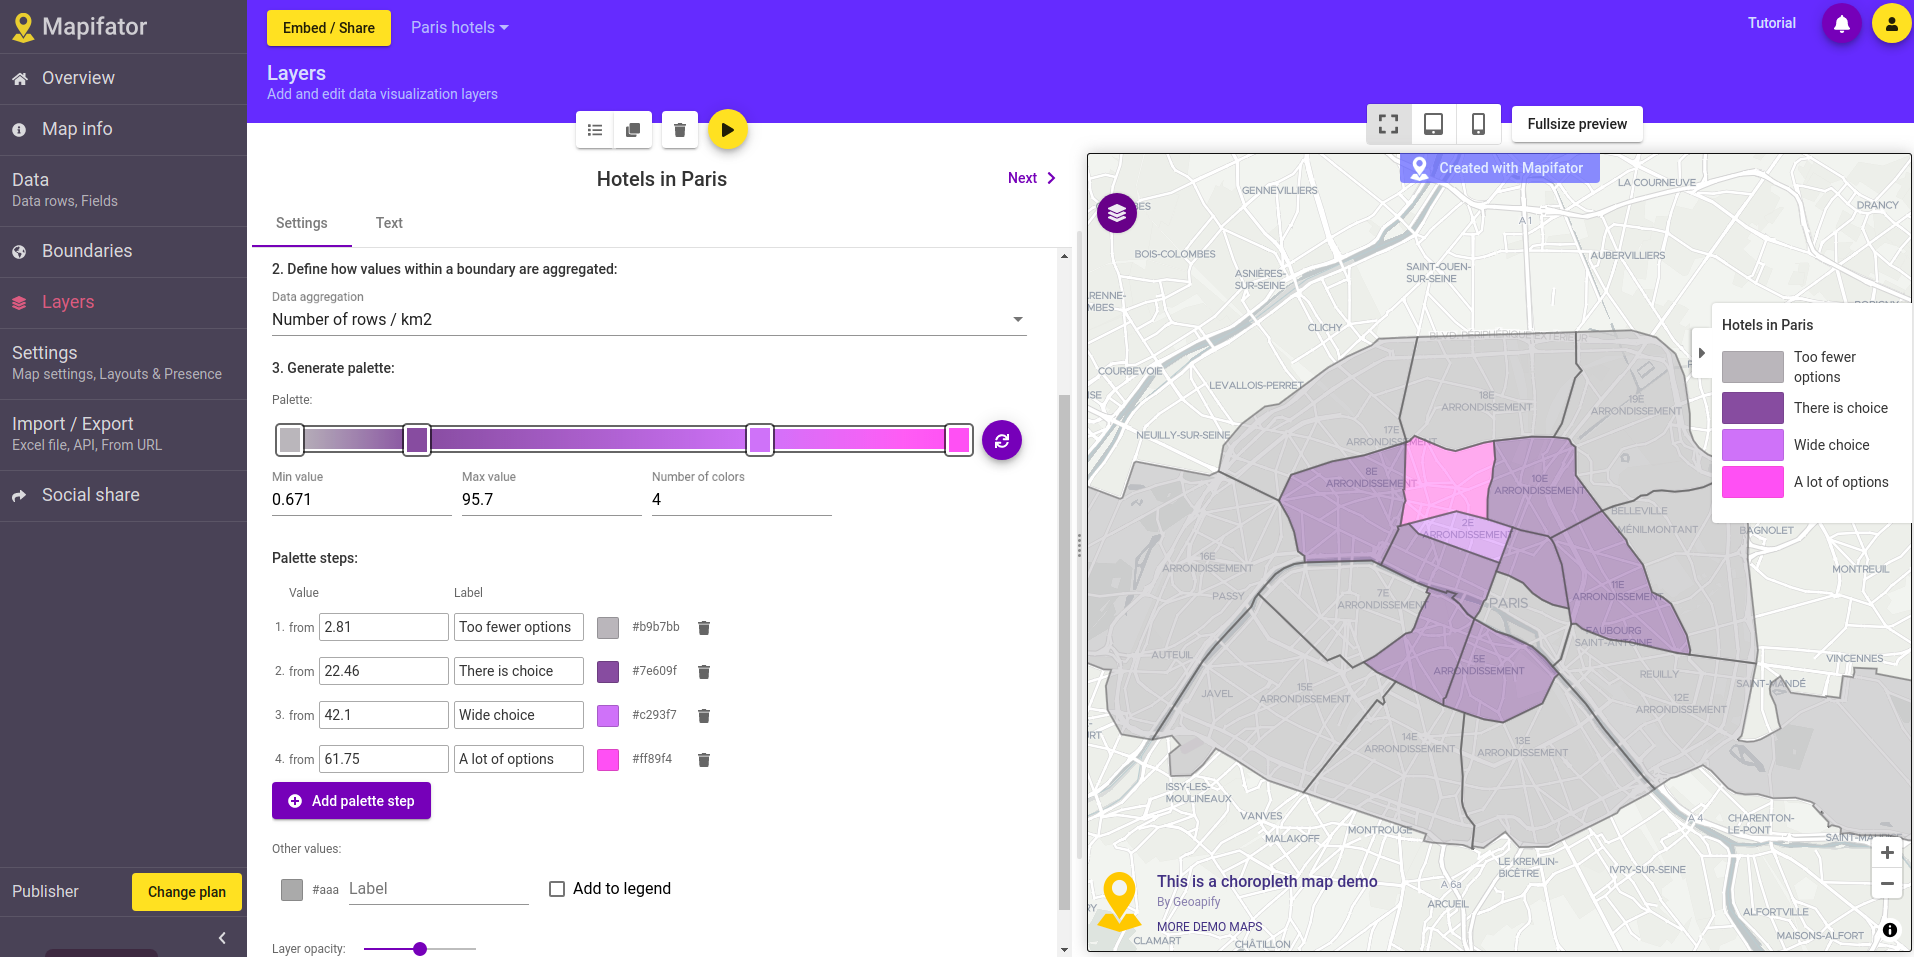
Choropleth mapTutorialData visualization layers in Choropleth mapsVisualize data on the map with data layers. Learn how to create and setup a data layer in Choropleth maps.
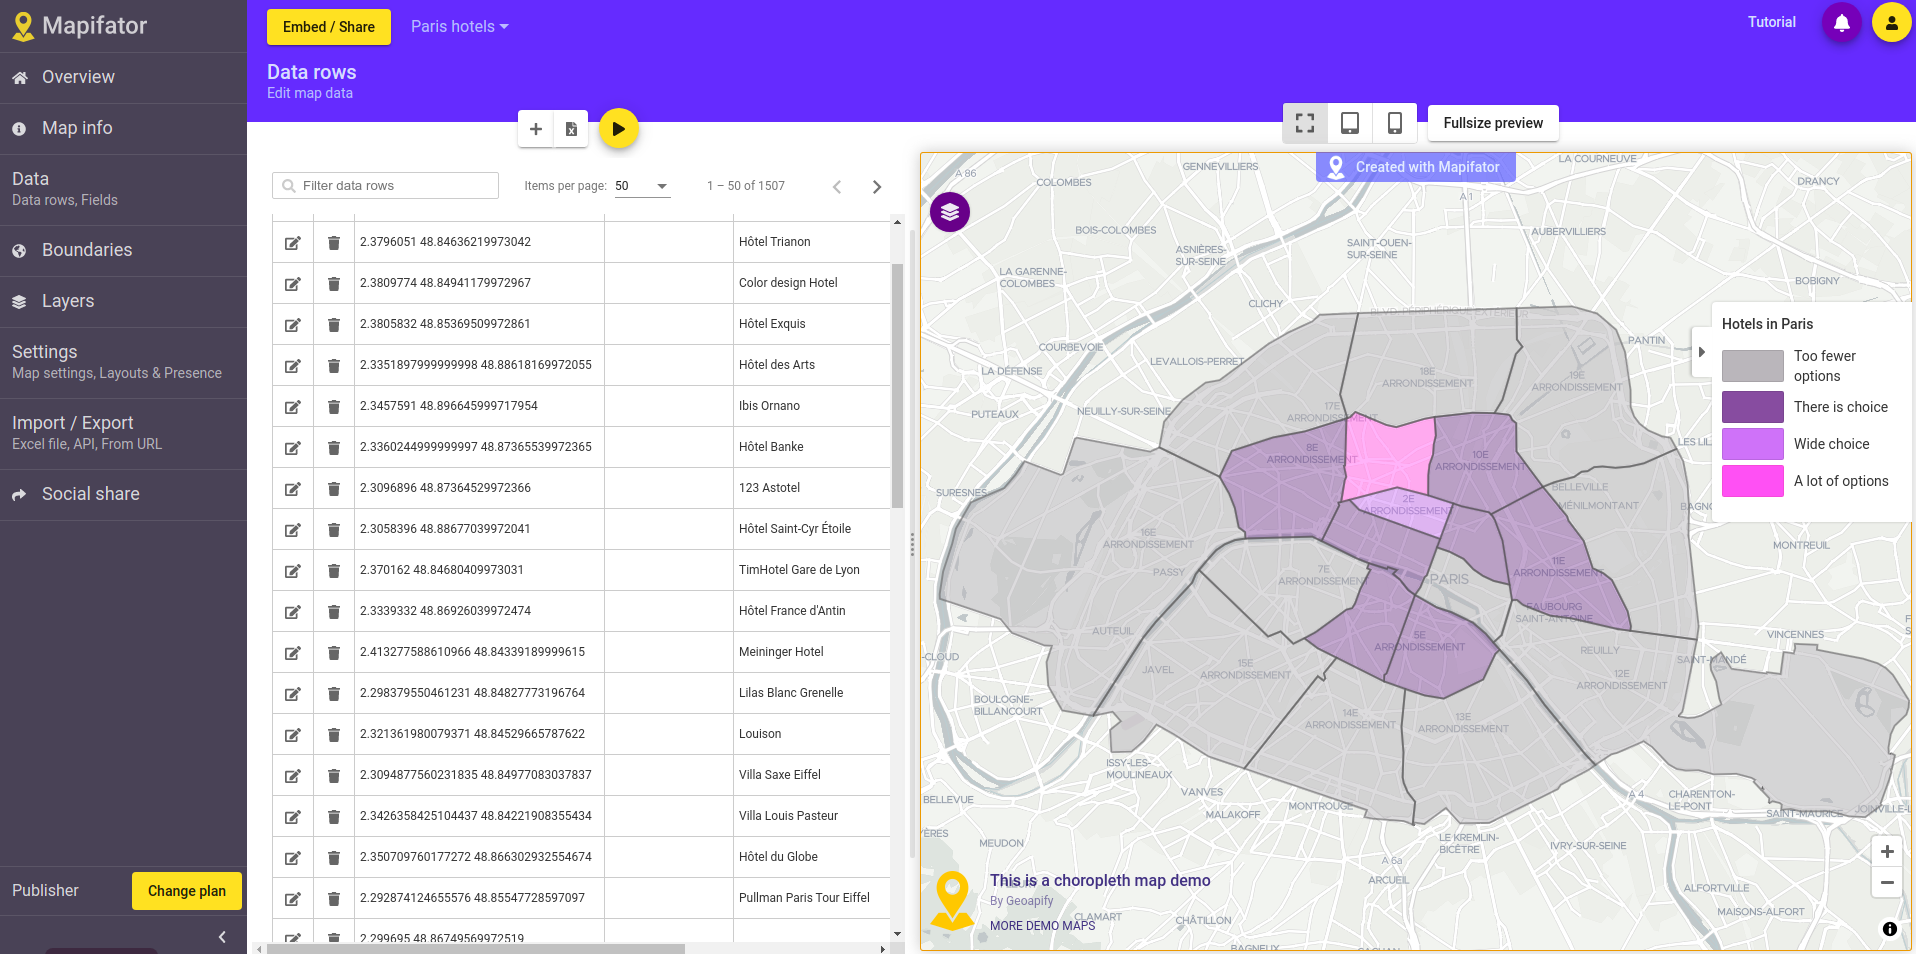
Choropleth mapTutorialImport dataCreate a choropleth map from an Excel or CSV file dataLearn how to visualize data from an Excel or CSV file on a Choropleth Map. Import data, choose boundaries, and setup a data layer.
Choropleth mapGetting startedTutorialChoropleth map editor tutorialIt's easy to create a choropleth map with Mapifator. Choropleth map editor lets you define all the map components with a graphical interface.